Release Notes - 18 March 2025
Updated one year ago /
1 min read
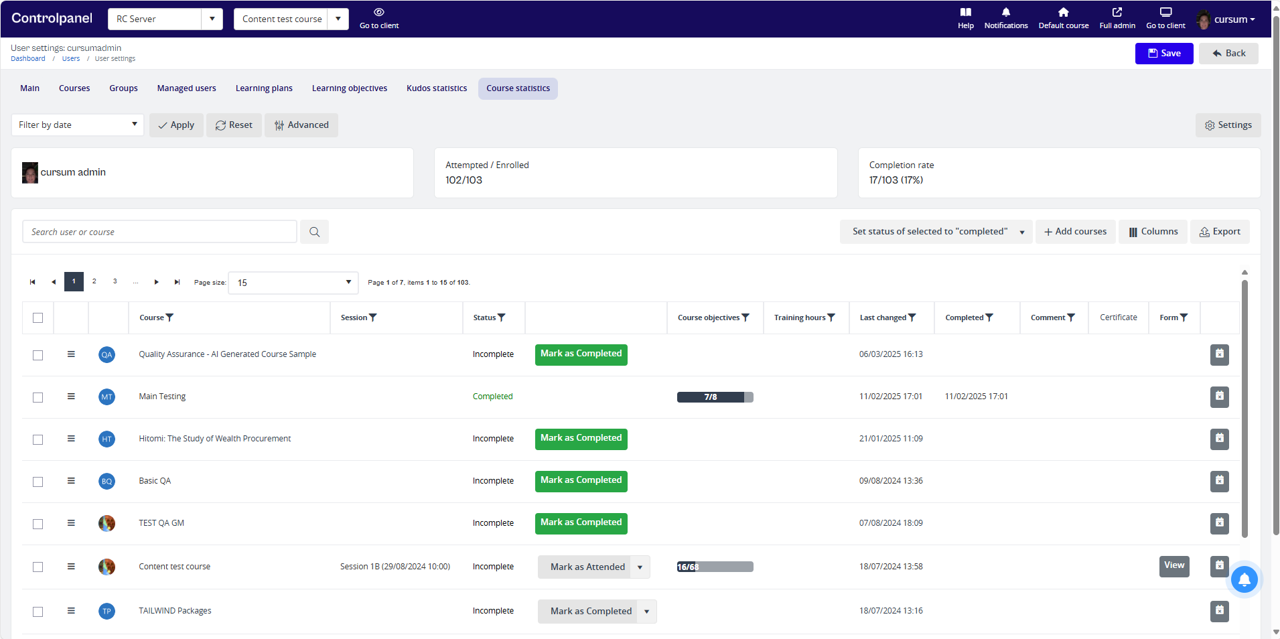
Course Statistics Page UI Enhancements
We’re excited to introduce a refreshed and optimized experience for the Course Statistics Pages! This update enhances usability, improves navigation, and provides a cleaner, more intuitive interface.
Key Enhancements:
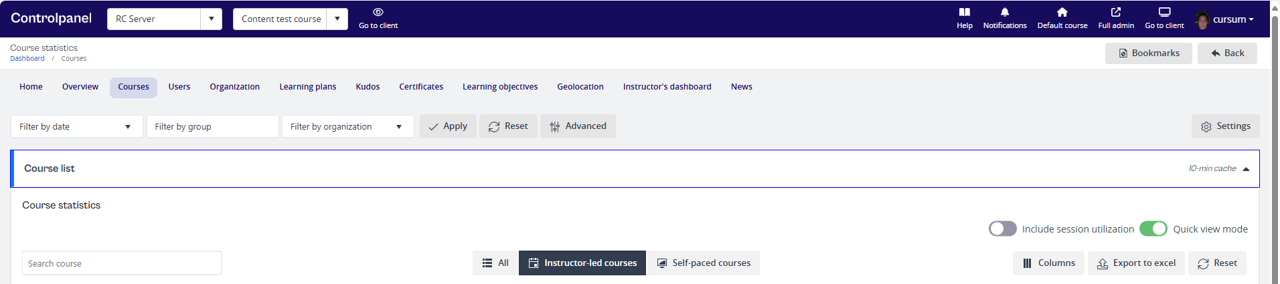
- Cleaner Interface
We’ve removed unnecessary elements to create a more focused and readable display, allowing users to navigate with greater ease.
- Improved Labeling
Labels have been updated to improve clarity, making information easier to understand at a glance.
- Refined Filters
Advanced filtering options have been introduced to make searches more efficient. Dropdown filters and the Apply button now feature an active state color change for better visibility and interaction.

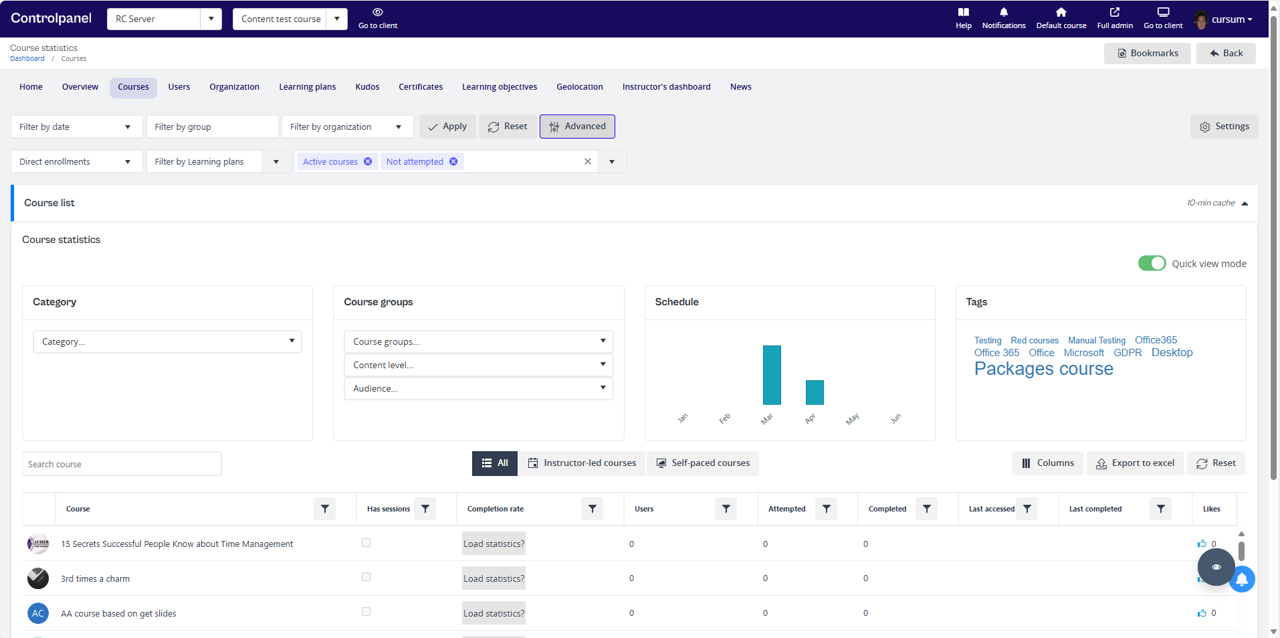
- Advanced Button Functionality
A new Advanced Button has been implemented to allow users to toggle dropdowns, graphs, and charts on demand.
- Clicking the button collapses (hides) dropdowns, graphs, and charts for a cleaner workspace.
- Clicking it again expands (shows) those elements, providing a flexible and customizable view.
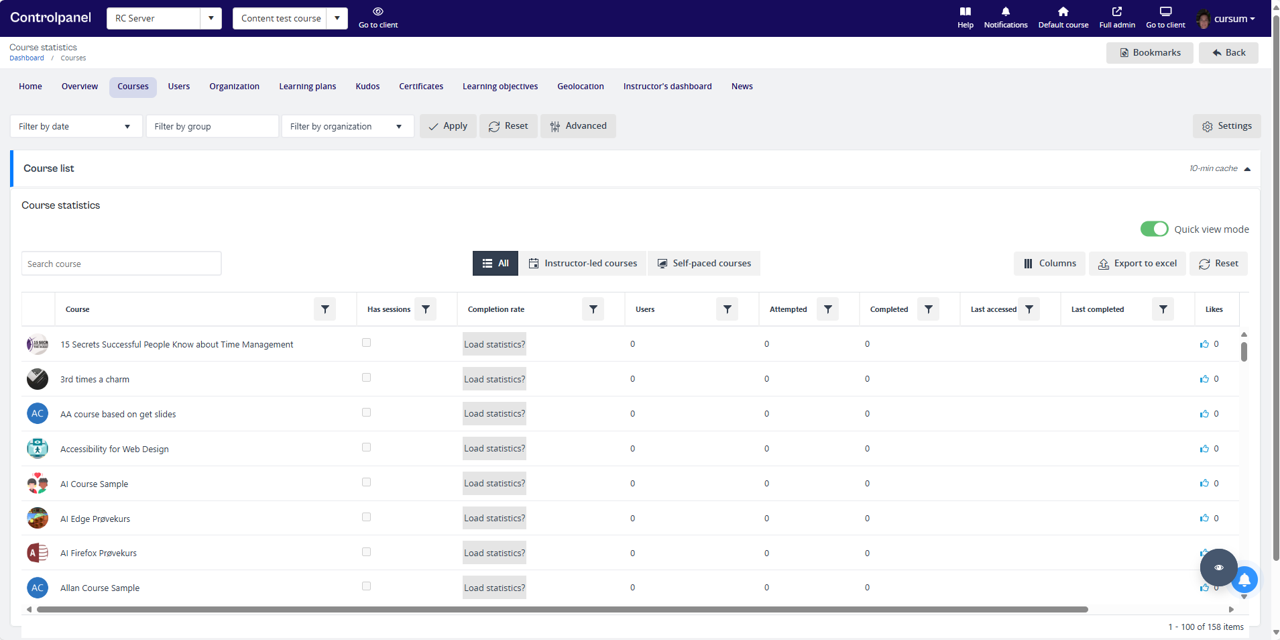
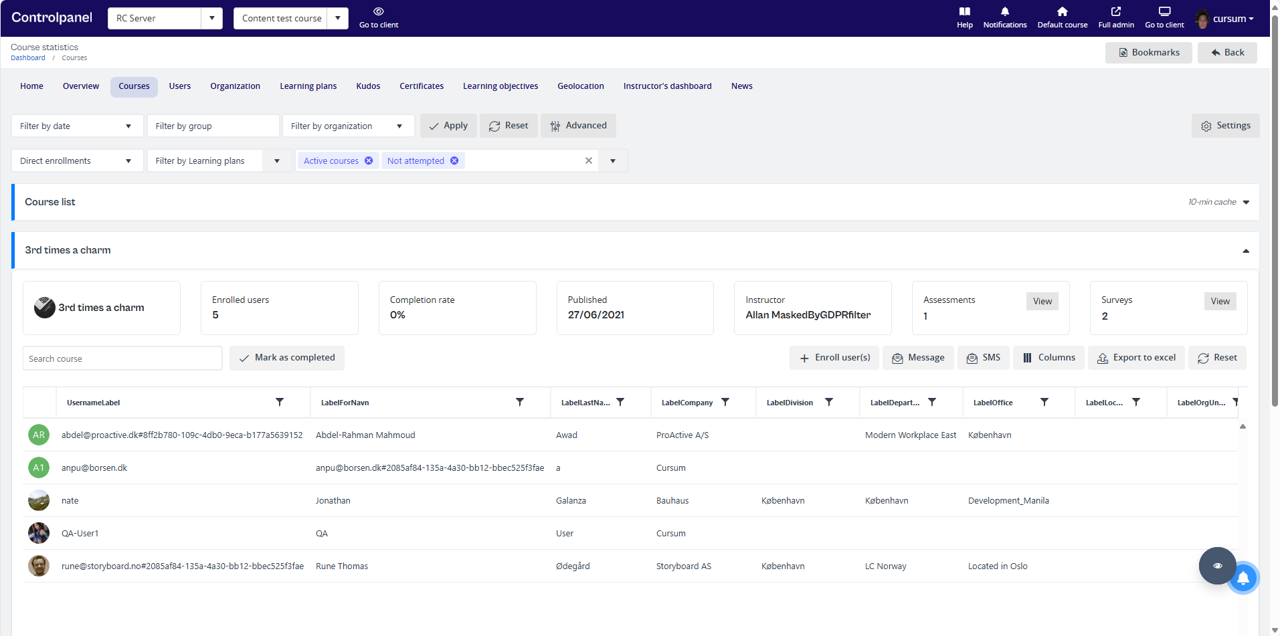
- Minimalist Tile Design
Tiles have been redesigned to display only essential data (numbers, percentages, and titles), ensuring a sleek and clutter-free interface.
- Responsive Grid Layout
When Advanced Settings are hidden, the grid now expands to 100% viewport height, maximizing visibility and improving data presentation.
What to Expect?
These enhancements provide a seamless and user-friendly experience, making data analysis and navigation faster, clearer, and more intuitive than ever before.
Stay tuned for more updates as we continue to refine and improve your experience!