Organizational Statistics
Updated 3 years ago /
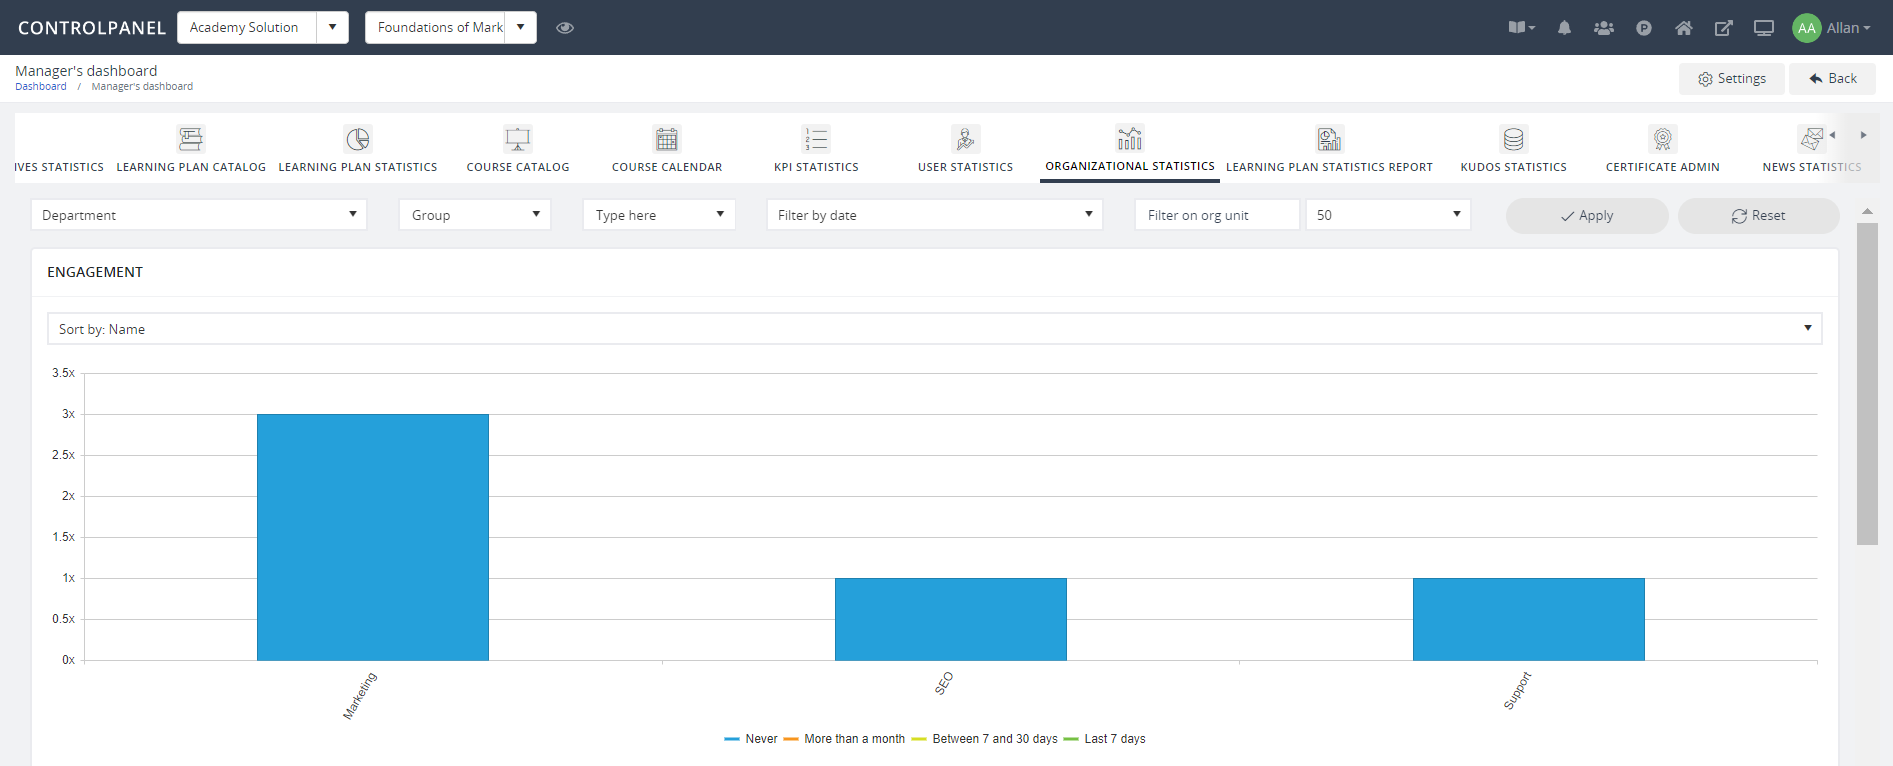
This page shows a series of graphs that indicate essential organizational statistics associated to courses, learning plans, kudos, and KPIs. Aside from the numerical data you’ll see in the page, bar graphs under the categories: engagement, courses, and learning plans were color-coded to represent different statuses. You can also manage the data by using the filters available on the page.