Use filters to generate a statistical view
Updated 3 years ago /
2 min read
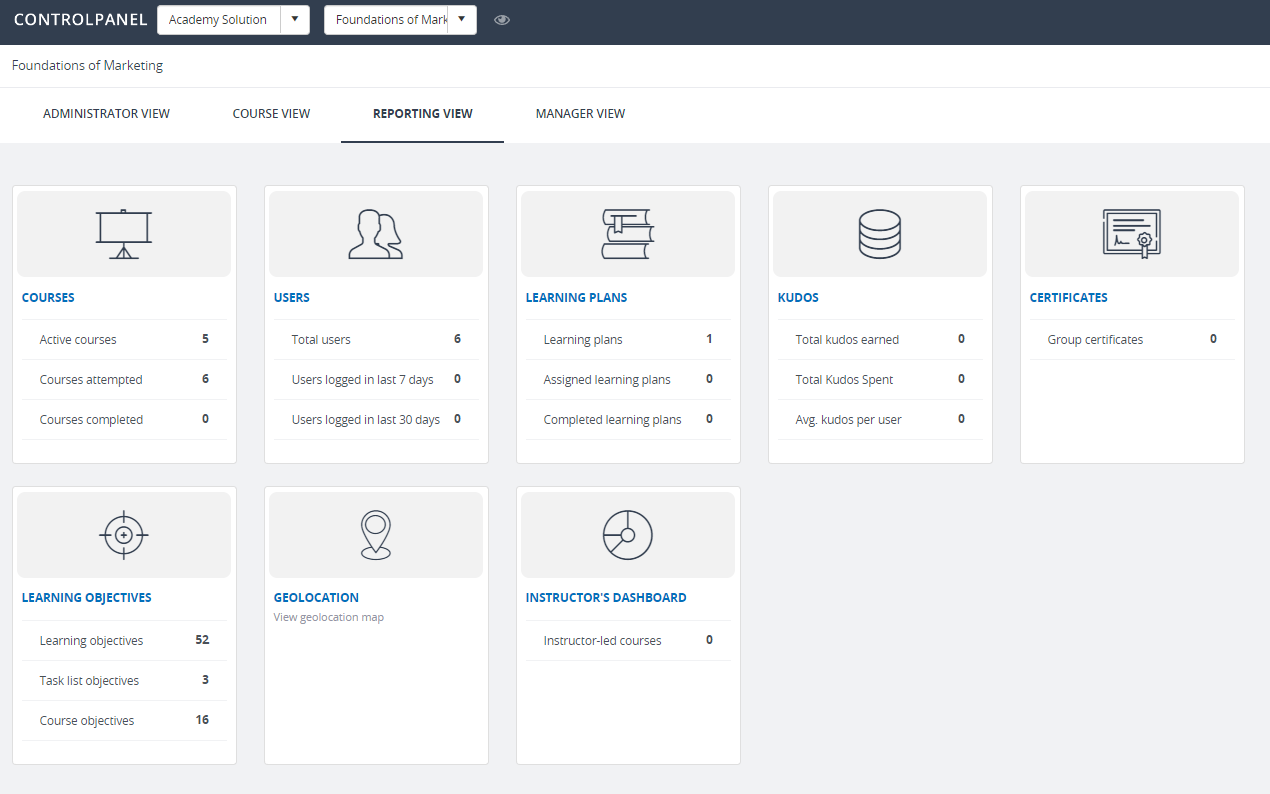
You can filter on what you want to see using the filter fields on the different Statistics pages. To use filters to generate a particular statistical view:
In the Control Panel, in Reporting view, choose a relevant card for what you want to view the statistics for.
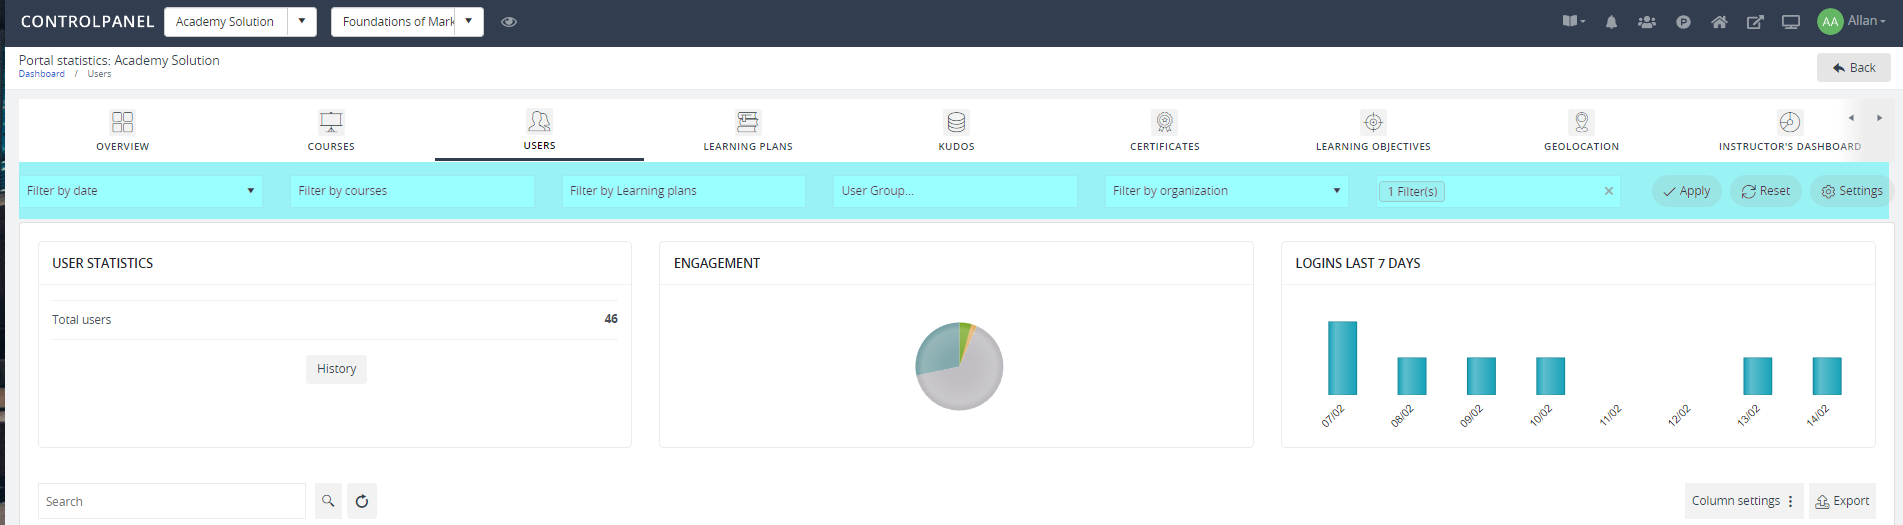
On the Statistics page, apply filters using the relevant filter fields:
Note
The filter fields available depends on the type of statistics that you are viewing.
-
Date – lets you specify the start and end date for the period for which you want to view the statistics for.
-
Courses – displays the list of courses available in your solution.
-
Learning Plans – shows you the list of learning plans available in your solution.
-
User Group – displays the list of groups available in your solution.
-
Organization – contains all the relevant organizations with their corresponding organization units.
You can sort the items within your results by clicking the column header – click once for ascending and twice to sort in descending order.
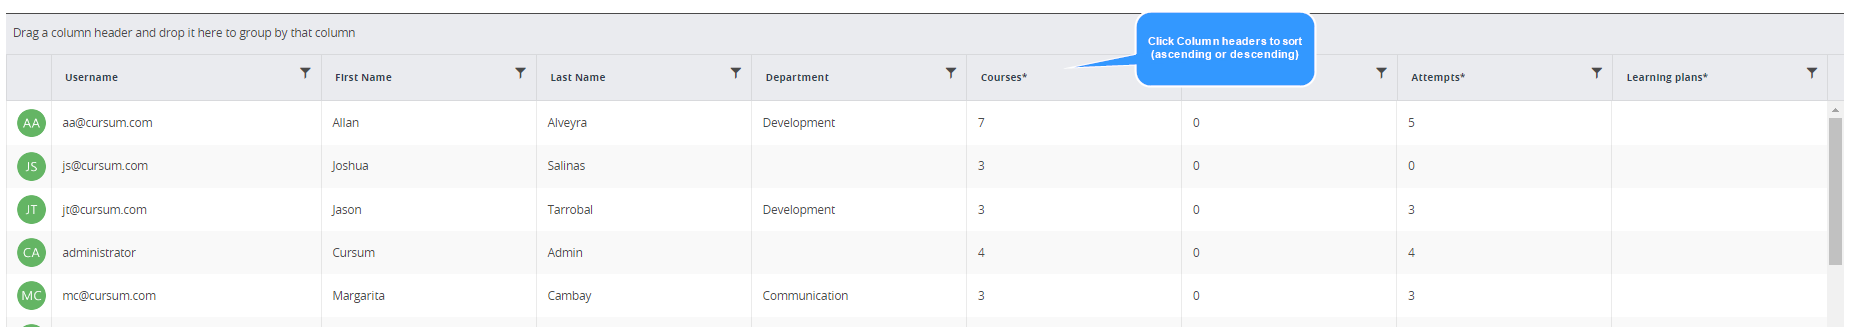
You can also apply additional filters on the results by clicking the Filter  icon then choosing a relevant filter, for example, Starts With.
Specify the value based on your chosen filter and click Filter.
If you want to export the view that you have generated to an Excel spreadsheet, click the
Export 
icon on the right.